Ethnicity
Ethnicity
New arrivals to the county may have a poor command of English, possess qualifications which are not generally recognised by employers, and be unfamiliar with the UK's culture; these factors affect pay. Furthermore, research suggests immigrants to Britain often work in low-paid occupations and are overqualified for the job they do.
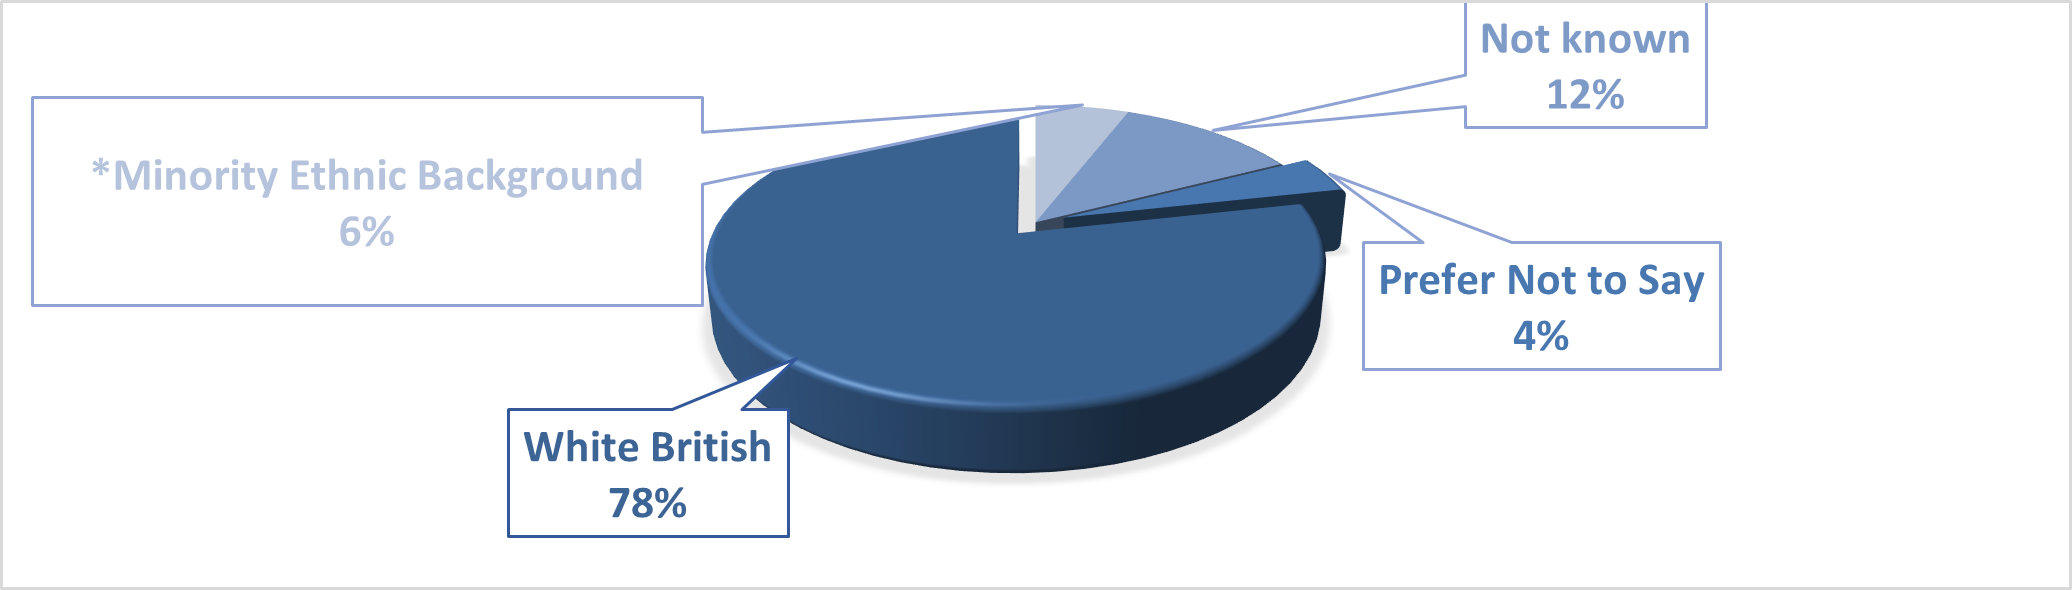
88.51% of Kent and Medway’s population is understood to be of White British, English, Scottish, Welsh, or Northern Irish heritage (Kent County Council, 2021). Minority ethnic representation across the county is 11.49%. We have used these two ethnic categorisations as the comparators in our pay gap reporting.
Ethnicity Profile
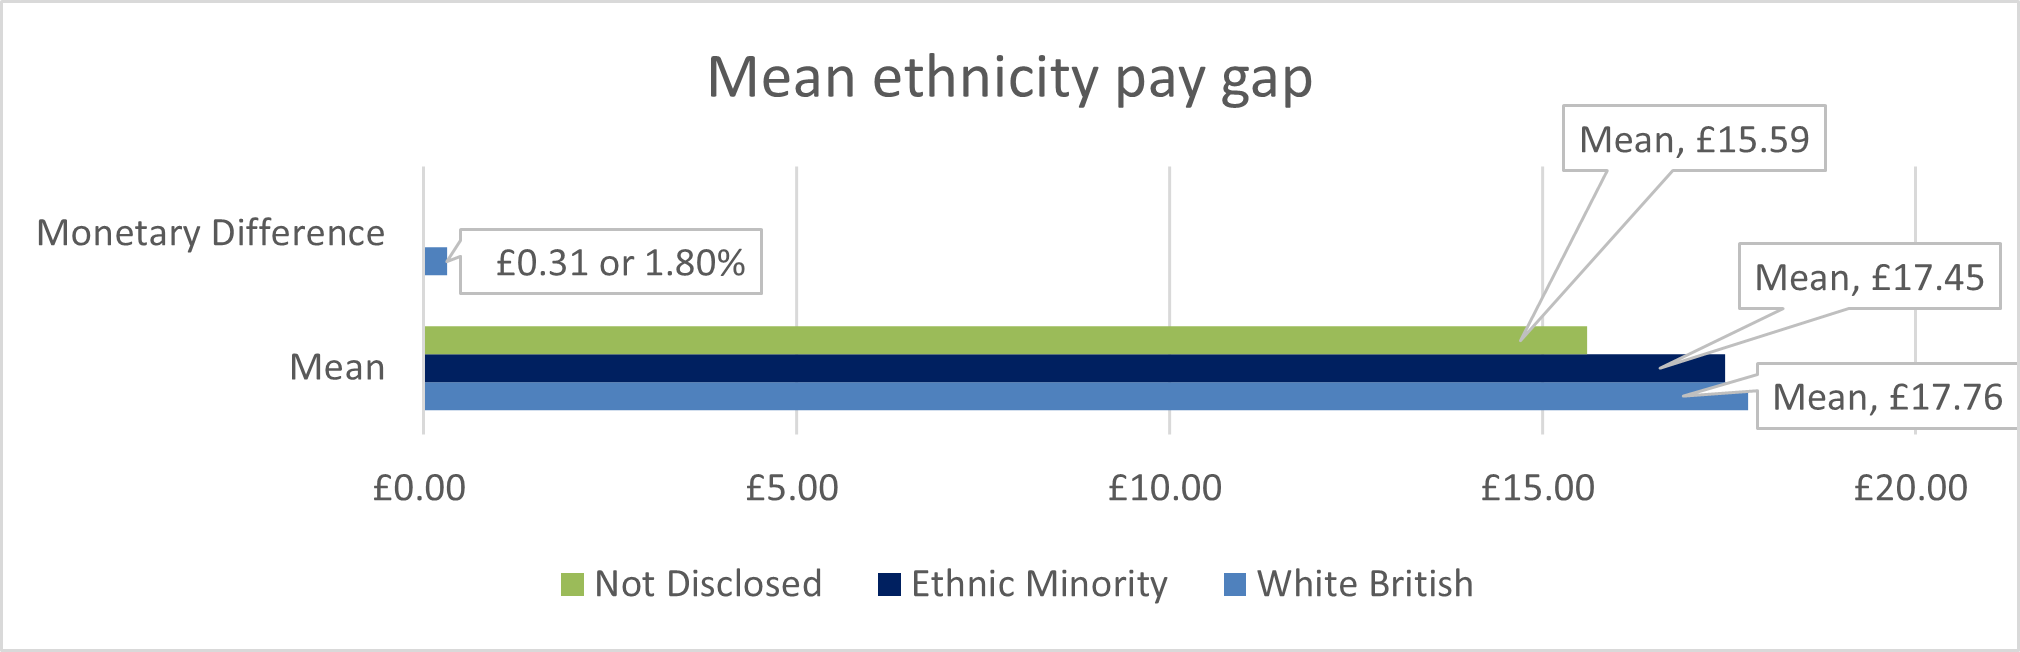
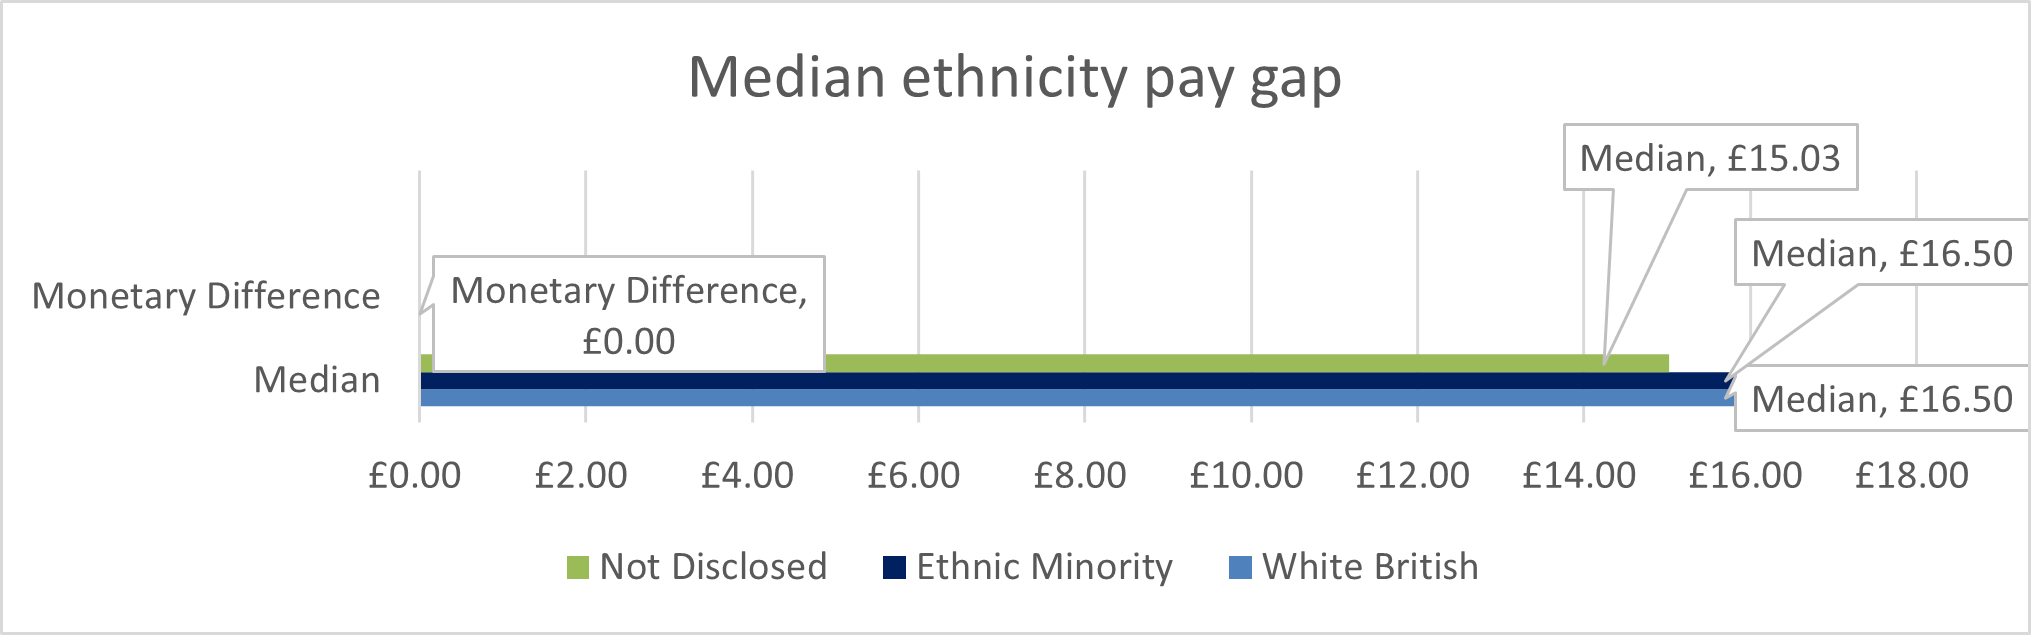
Mean and median ethnicity pay gaps
Compared with 2021 the mean pay gap has increased from -0.2% to 1.8% meaning people who identify as White British receive on average £0.31 more that the rate of pay received by Ethnic Minorities. We believe this to be because of increased disclosure and now have a more accurate picture of representation across the organisation. In contrast the median pay gap indicates that at the mid salary point of the service there is no ethnicity pay gap.
It is worthy of note, 16% of our workforce have not disclosed their ethnic identity, the mean pay for this group is £15.59 and the median is £15.03 both of which are lower than the comparator groups.
| 2022 | From Hourly Rates 2022 | To Hourly Rates 2022 | No. White British 2022 | % 2022 | No. Ethnic Minority 2022 | % 2022 | No. Not Disclosed 2022 | % 2022 | Total 2022 |
|---|---|---|---|---|---|---|---|---|---|
| Upper | £18.26 | £83.01 | 338 | 87.6 | 24 | 6.2 | 24 | 6.2 | 386 |
| Upper Middle | £16.19 | £18.26 | 321 | 83.2 | 19 | 4.9 | 46 | 11.9 | 386 |
| Lower Middle | £15.03 | £16.19 | 283 | 73.3 | 22 | 5.7 | 81 | 21.0 | 386 |
| Lower | £10.01 | £15.03 | 285 | 73.6 | 17 | 4.4 | 85 | 22.0 | 387 |
| Total | - | - | 1,227 | 79.4 | 82 | 5.3 | 236 | 15.3 | 1545 |
Ethnicity by quartile
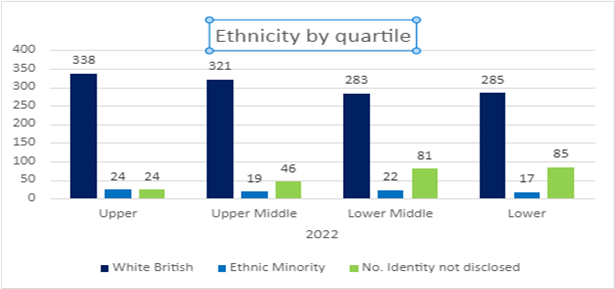
The quartile table indicates the number of people who are not from a White British background has increased in the upper quartile by 2 compared to 2021 and this is now the quartile with the most significant representation containing 24 people or (6.2%). In terms of disclosure, the level of unknown data in the lower quartile remains the highest, but it also contains the highest levels of minority more than double that of the upper and upper middle quartiles. There needs to more work to encourage people from these lower quartiles to disclose their identities.