Kent Fire and Rescue Service Methodology
Until there is official guidance setting out the way in which the report is to be compiled, we are using the comparison with the majority group.
The employee definitions used are the same as for the gender pay gap. For the Ethnicity Pay Gap Report, we considered those who identified as White British, those who did not and those for whom we do not have data. For the Disability Pay Gap Report we considered those who declared a disability, those who did not and those for whom we do not have data. For the Sexual Orientation Pay Gap Report we considered those who identify as LGBT+ and those who identify as heterosexual and those for who we do not have data. We have not at this point been able to consider the intersectionality of sex, ethnicity, disability, sexual orientation, or a combination thereof on a person.
The data
This year’s calculations are based on the “snap shop” date of 31 March 2021 and on a total of 1530 staff, the breakdown of our staff is detailed in the table below:
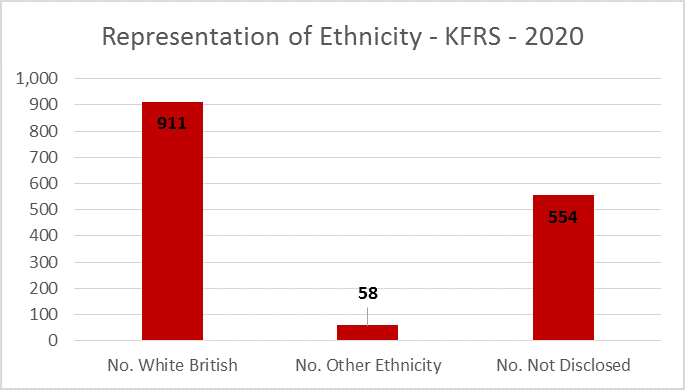
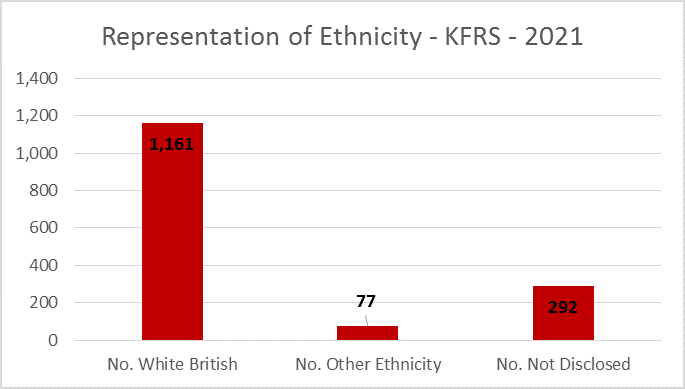
Ethnicity
| Group | Number | Percentage |
|---|---|---|
| White British | 911 | 59.8 |
| Other Ethnicity | 58 | 3.8 |
| Equality Data Unknown | 554 | 36.4 |
| Total | 1523 | 100 |
| Group | Number | Percentage |
|---|---|---|
| White British | 1161 | 75.9 |
| Other Ethnicity | 77 | 5.0 |
| Equality Data Unknown | 292 | 19.1 |
| Total | 1530 | 100 |
We recognise KFRS is not representative of the ethnicity of Kent and Medway as we would like, but we are taking steps to improve this as demonstrated in our pay gap. Since reporting in 2020, the representative ethnicity of our workforce has increased by 1.2%.
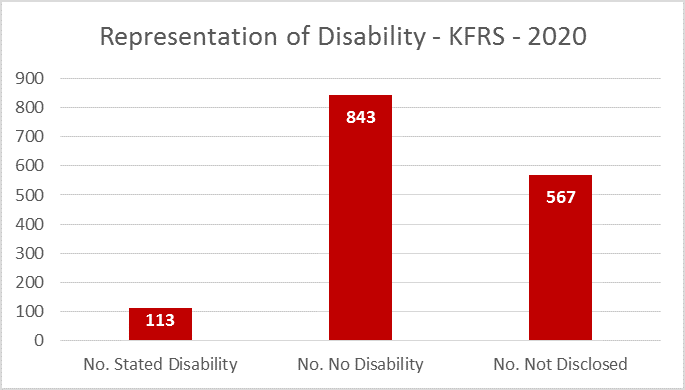
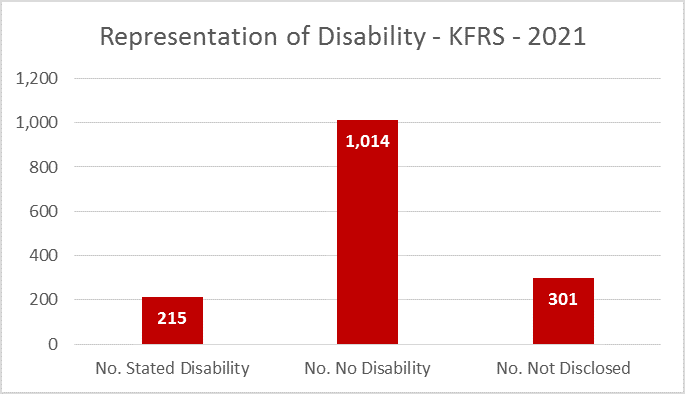
Disability
| Group | Number | Percentage |
|---|---|---|
| No disability | 843 | 55.4 |
| Disability | 113 | 7.4 |
| Equality Data Unknown | 567 | 37.2 |
| Total | 1523 | 100 |
| Group | Number | Percentage |
|---|---|---|
| No disability | 1014 | 66.3 |
| Disability | 215 | 14.0 |
| Equality Data Unknown | 301 | 19.7 |
| Total | 1530 | 100 |
We are keen to promote and value differences across protected characteristics, as we view disability as advantageous and aim to create a culture where differences are valued. We are pleased that the number of employees disclosing a disability has nearly doubled rising from 113 in 2020 to 215 in 2021.
Sexual orientation
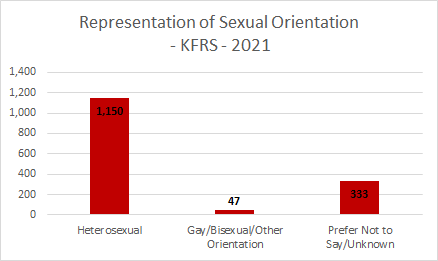
| Group | Number | Percentage |
|---|---|---|
| LGBT+ | 47 | 3.1 |
| Heterosexual | 1150 | 75.2 |
| Equality Data Unknown | 333 | 21.8 |
| Total | 1530 | 100 |
Improving disclosure is important to us, not only in terms of figures but also in the organisational culture it promotes. In our pay gap reporting last year, we set a target to improve disclosure by 50%.
In 2020, the unknown equality data for the ethnicity of our employees was 36.4% – this has reduced to 19.1%. The unknown equality data for disability was 37.2% which has reduced to 19.7% in 2021. The unknown equality data for Sexual Orientation was slightly higher at 21.8%.
Whilst we did not manage our target, we are pleased with progress and remain committed to improving disclosure.